STAT 20: Introduction to Probability and Statistics
2009 Iran Election
Background
Ongoing public sentiment that previous election was fraudulent
The highest voter turnout in Iran’s history
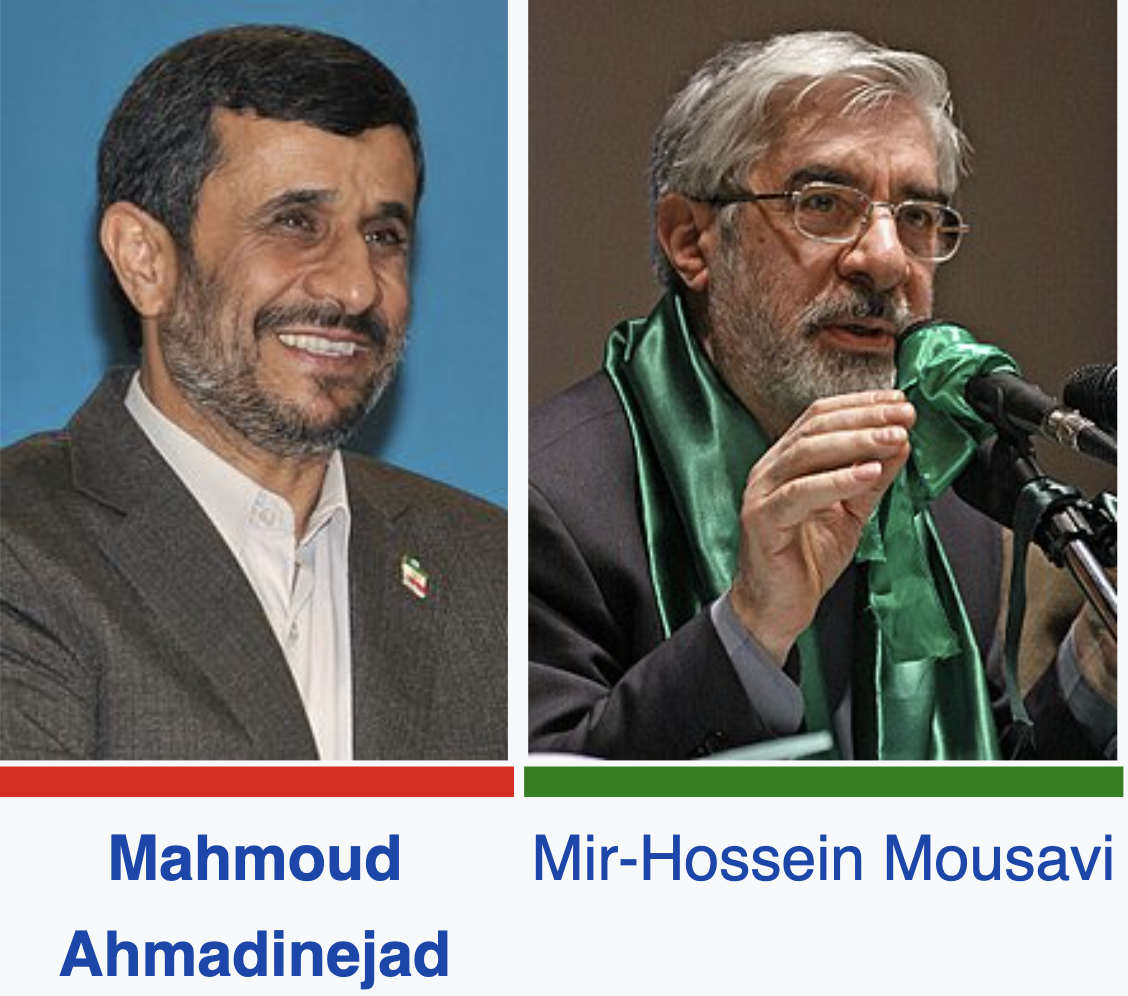
Leading candidates
Mahmoud Ahmadinejad: Leader of conservatives and incumbent president.
Mir-Hossein Mousavi: Reformist and former prime minister. Seeking rapid political evolution.
Outcome
Ahmadinejad won the election with 62.6% of the votes cast, while Mousavi received 33.75% of the votes cast.
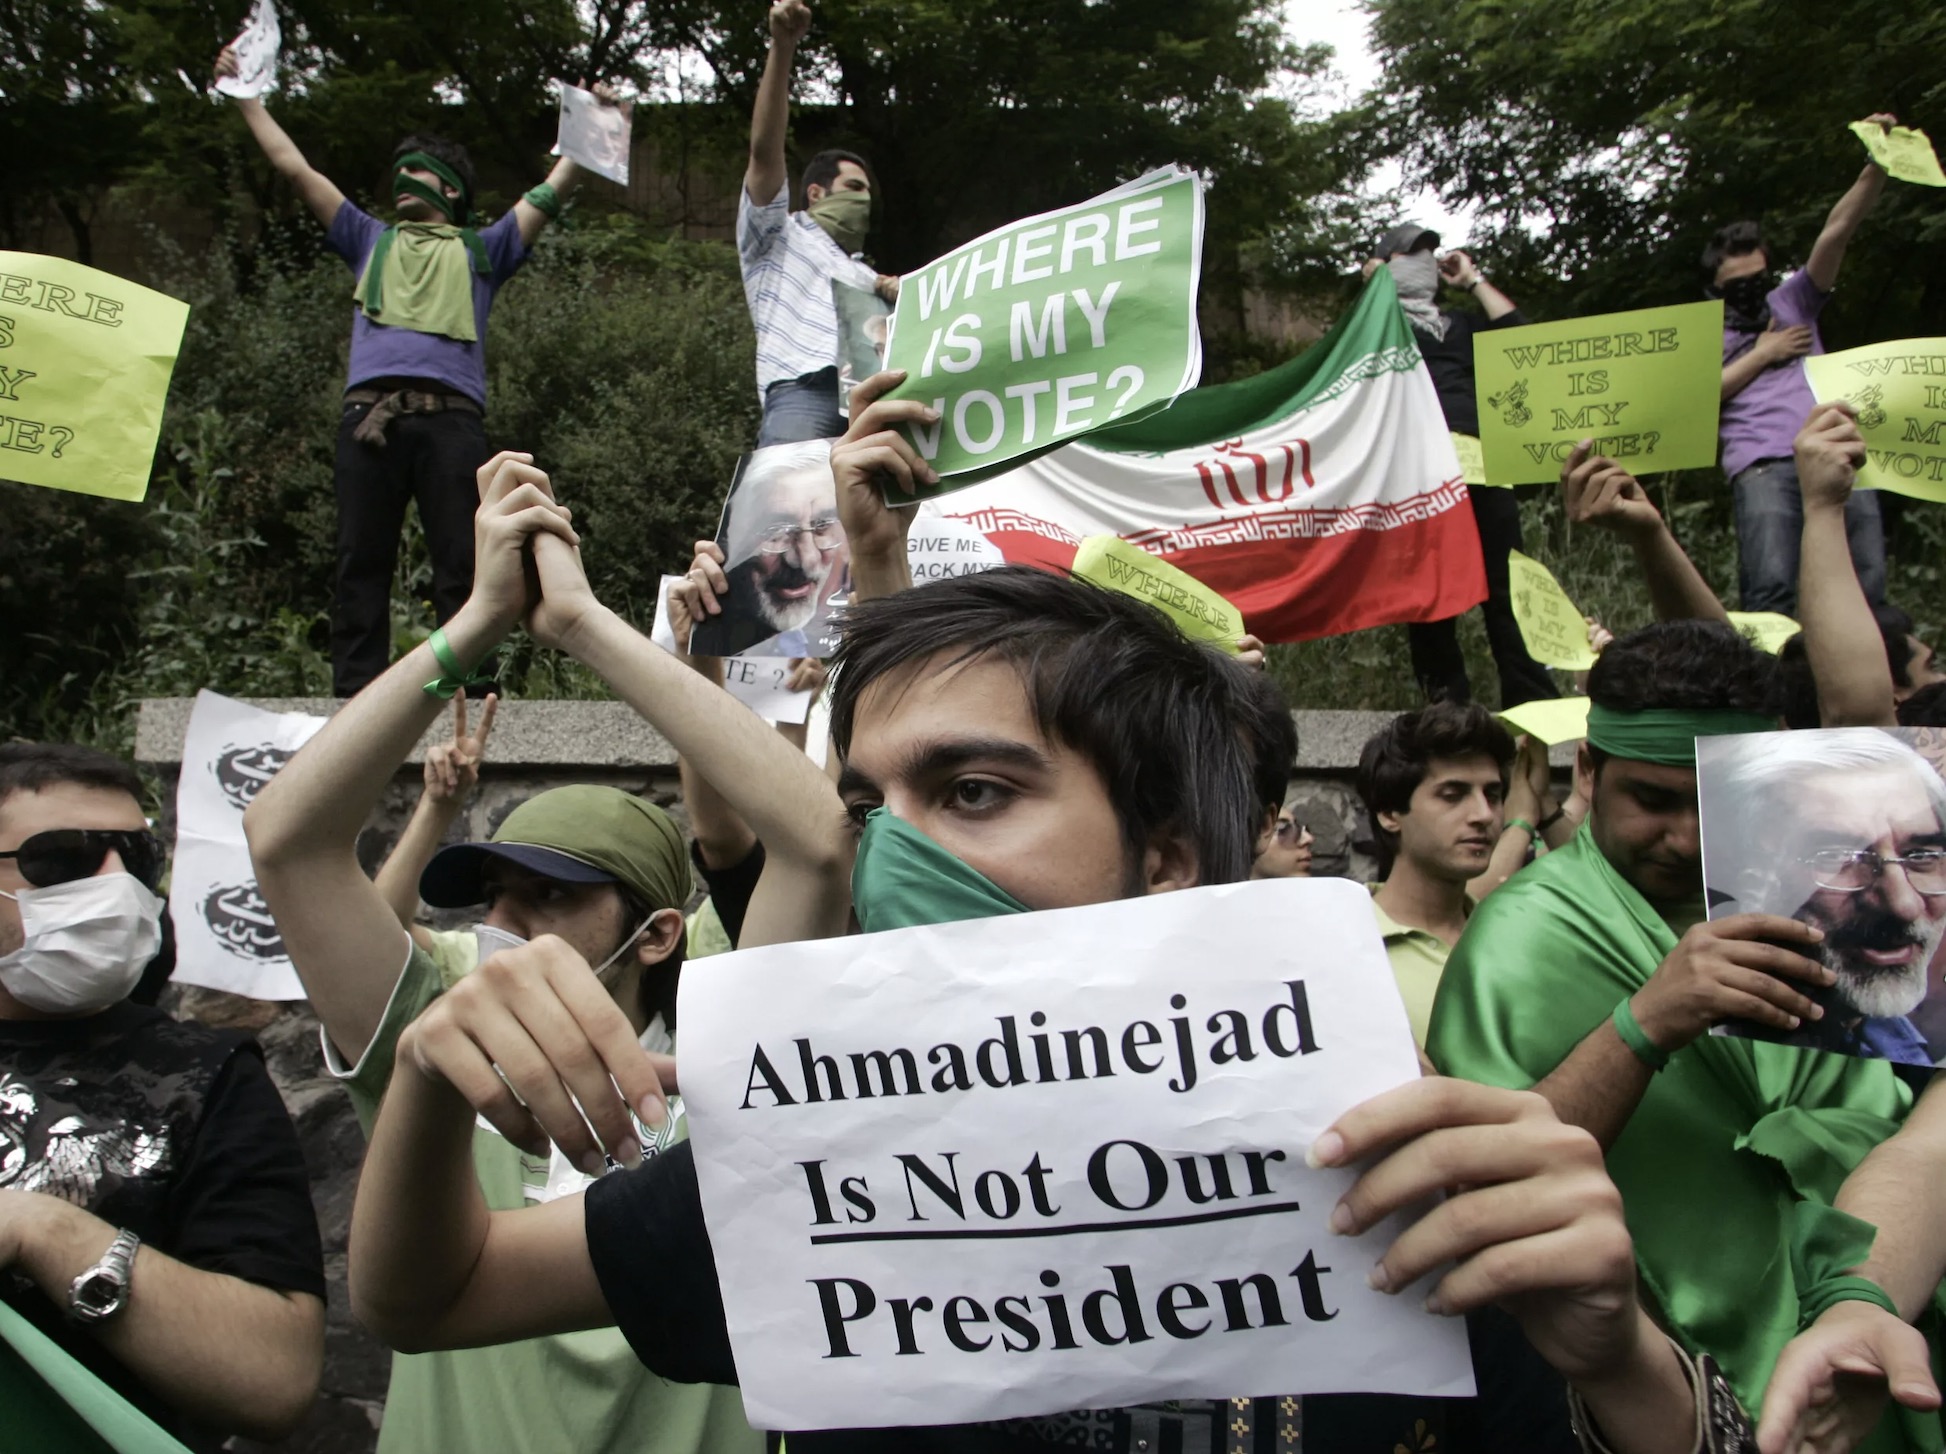
Post-election controversies and unrest
Allegations of fraud
Public protests and unrests
The green wave movement, led by Mousavi, against the allegedly fraudulent election and Ahmadinejad’s regime
Was the election fraudulent?
Benford’s Law
What is the distribution of city/town populations in all cities and towns in California?
What is the distribution of the first digit of city/town populations in all cities and towns in California?
Benford’s Law
Let \(X\) be the first digit of a randomly selected number. \(X \sim Benfords()\) if
\[P(X = x) = \log_{10}\left(1 + 1/x \right)\]
Benfords Law and Elections
Fraud detection using Benford’s Law
A common theory is that in a normally occurring, fair, election, the first digit of the vote counts county-by-county should follow Benford’s Law. If they do not, that might suggest that vote counts have been manually altered.
This theory was brought to bear to determine whether the 2009 presidential election in Iran showed irregularities1.
Lab: Elections
In this lab we will:
Examine the Benford’s Law probability distribution
Compare the first digits of vote counts in the 2009 Iranian election to this distribution
Reach a conclusion on whether the election was fraudulent (or whether the Benford’s Law is a good tool at detecting fraud in the first place).